
Esport monitoring — chart dashboard
The client needed a responsive Flutter frontend with interactive charts that make esport monitoring data readable at a glance.
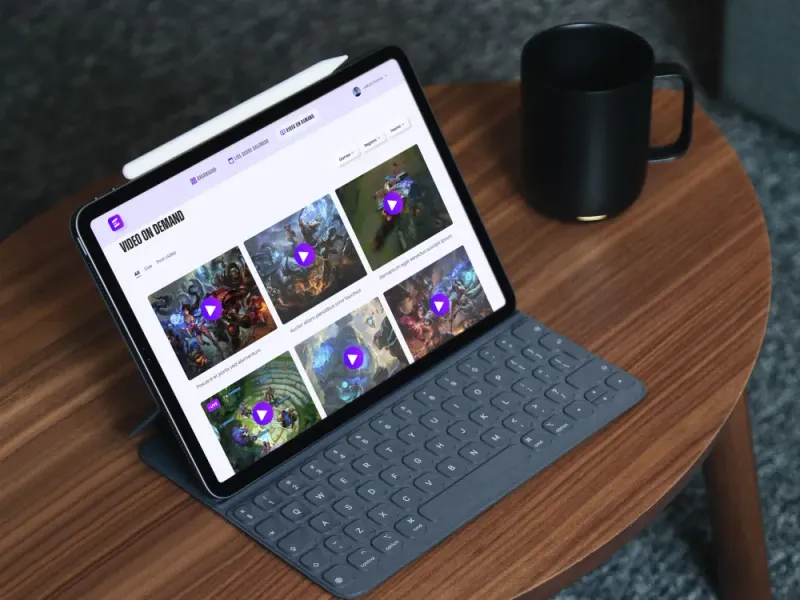
What it looks like
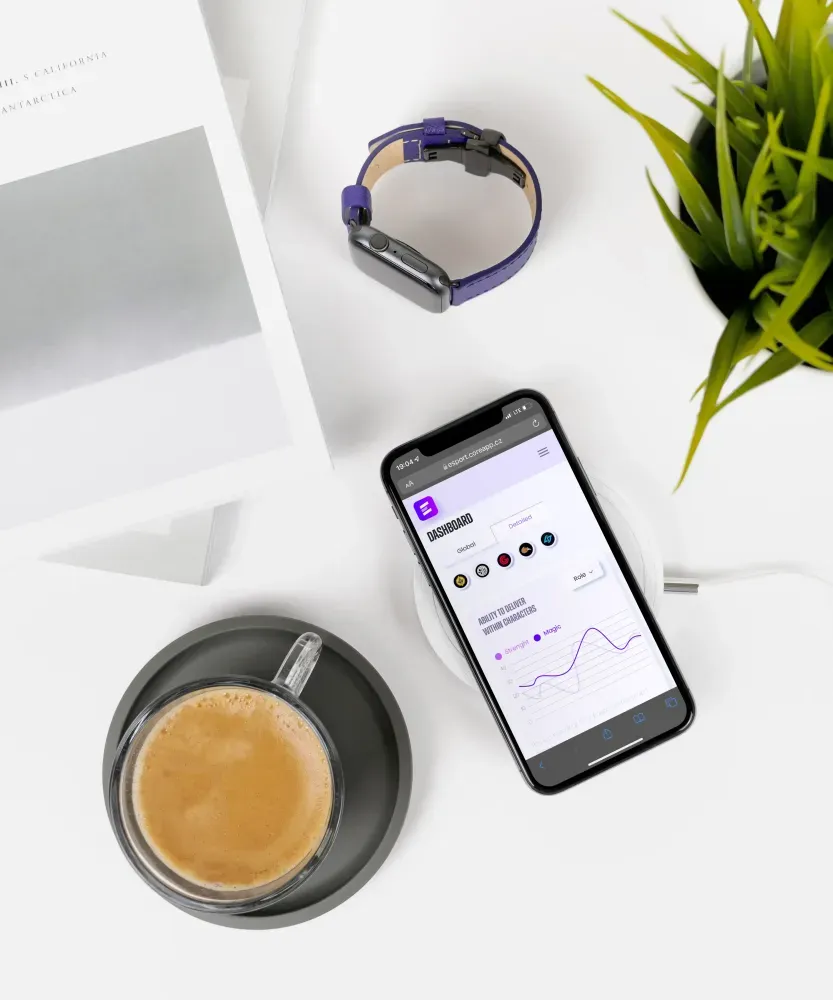


The challenge
The client commissioned us to create the frontend using the Flutter framework. The goal was to have a responsive web environment with several interactive charts for data presentation.
What we did
To ensure full functionality of the charts as per the requirements, we had to modify the chart rendering module. Subsequently, we resolved responsive rendering in the browser using Flutter widgets. Lastly, we addressed loading speed without relying on the browser's cache.
Chart Rendering
For reliable chart rendering, we customized the core chart libraries.
How it helped
Interactive charts replace raw dumps. The Flutter frontend keeps a consistent look across devices. Operators spot trends and anomalies faster than scrolling spreadsheets.
- UI
- Flutter frontend
- Viz
- Interactive charts
- Format
- Responsive
Have a similar project?
Write a short note about what you need. We usually reply within 24 hours.
Contact